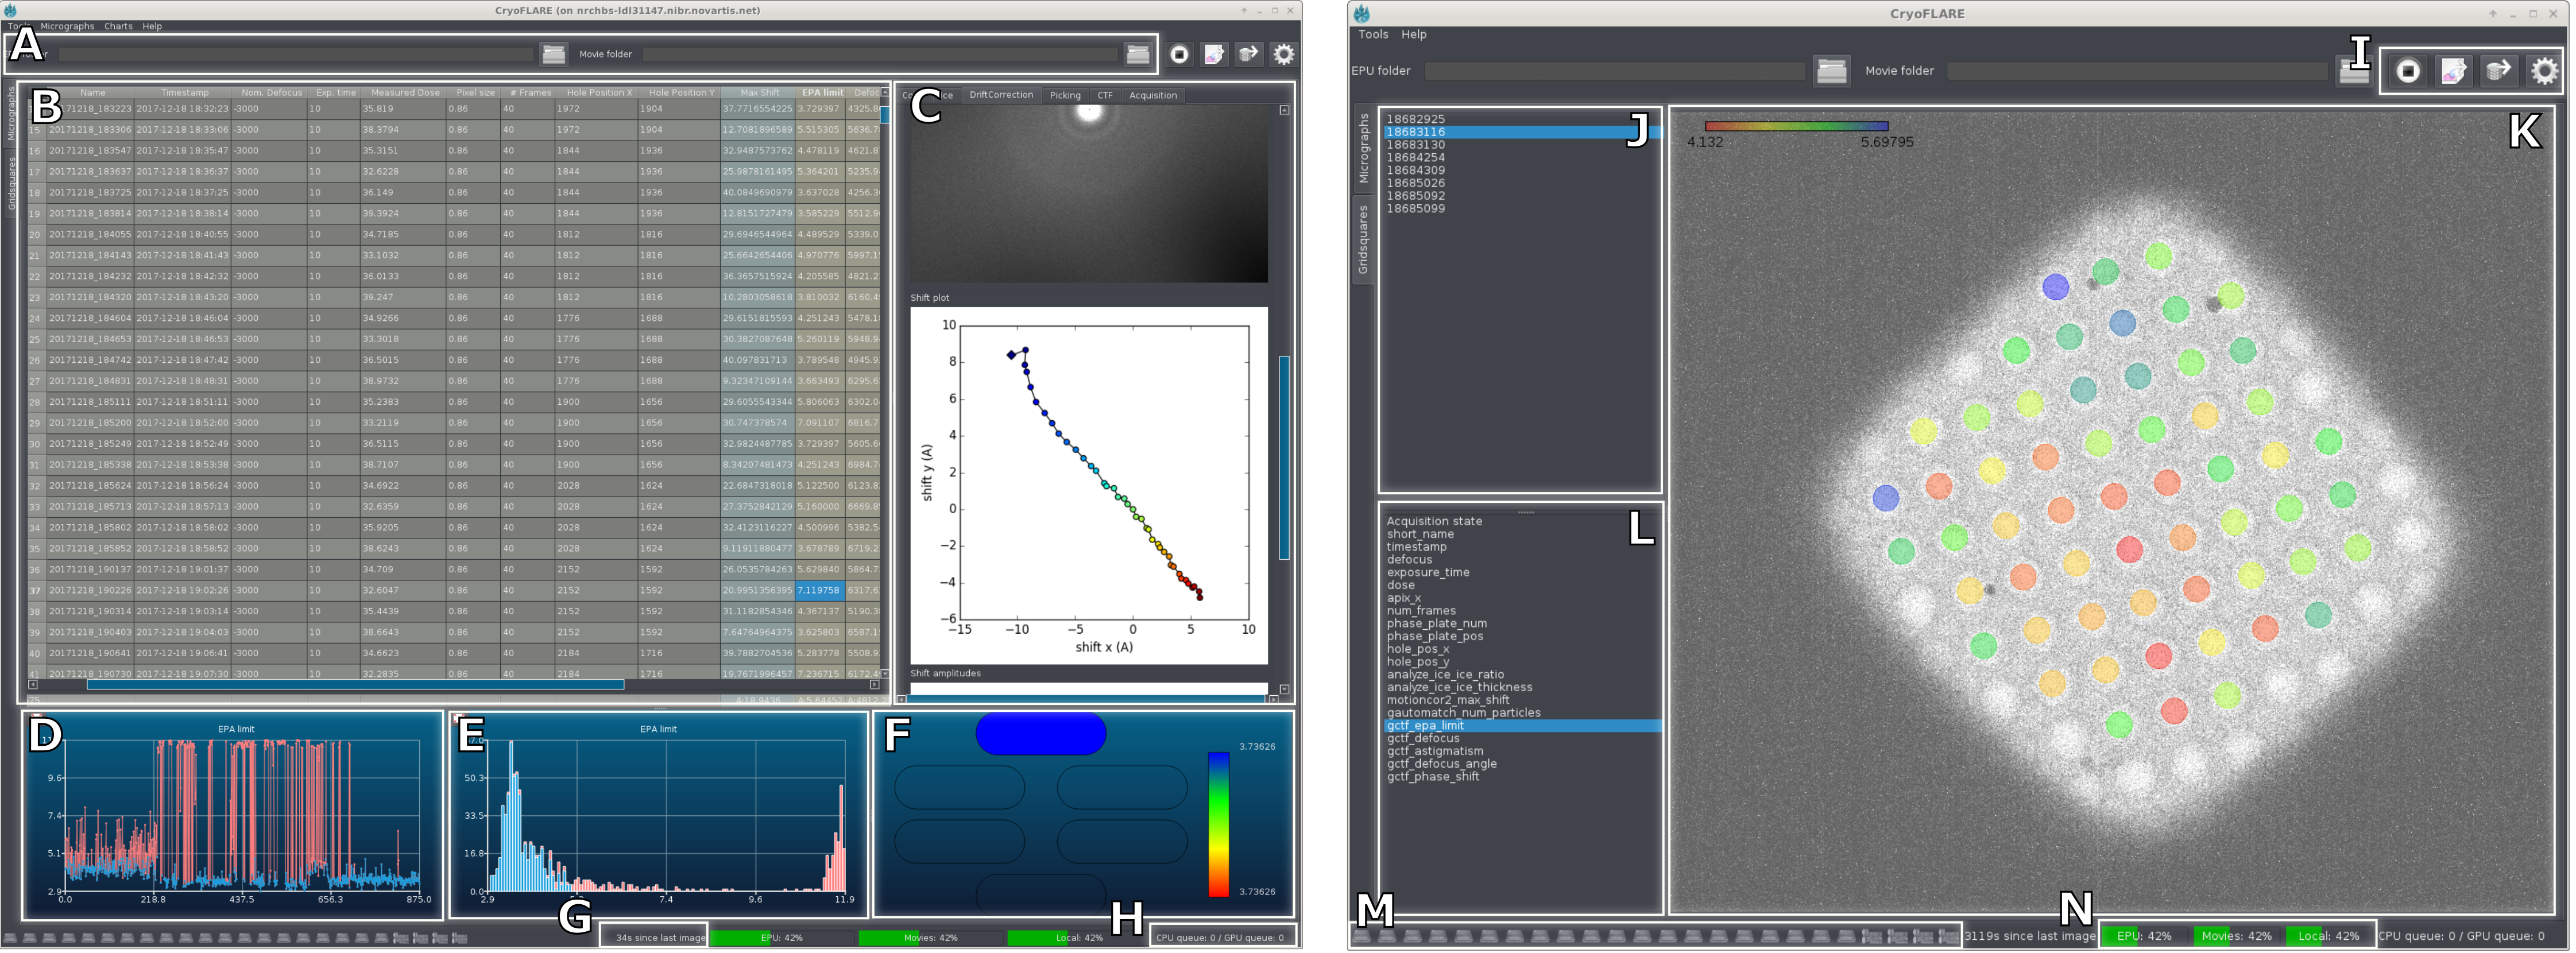
 A) Project and movie folder selection. (B) List of micrographs displaying results from acquisition and processing. (C) Detail panel showing results from currently active micrograph as well as input form for user defined parameters. (D) Linear plot. (E) Histogram. (F) Phase plate heat plot. (G) Counter indicating time since last acquisition. (H) CPU and GPU queue (I) Buttons for export, reporting, start/stop and settings. (J) Grid square selection. (K) Grid square display with heat plot overlay. (L) Parameter selection for heat plot. (M) CPU and GPU activity display. (N) Disk usage display.
The project selection allows to select the folder containing the data acquired by the microscope.
The metadata folder path should point to the top of the directory tree containing the metadata for the data acquisition. In case of EPU data this would be the main EPU folder.
The movie folder should point to the top of the directory tree containing the movie data. For EPU data this folder in general has the same name as the metadata folder, but might be located on a different PC, e.g. on in the DoseFractions folder on the Gatan PC for a K2 camera or on the Offloadserver for a Falcon III camera.
The micrograph summary contains table listing all acquired micrographs and their key metadata (as defined in the task settings).
The micrograph details show result images for the currently selected micrograph organized into separate tabs for each processing task. In addition, each tab contains a list of input parameters (as defined in task settings) for each task.
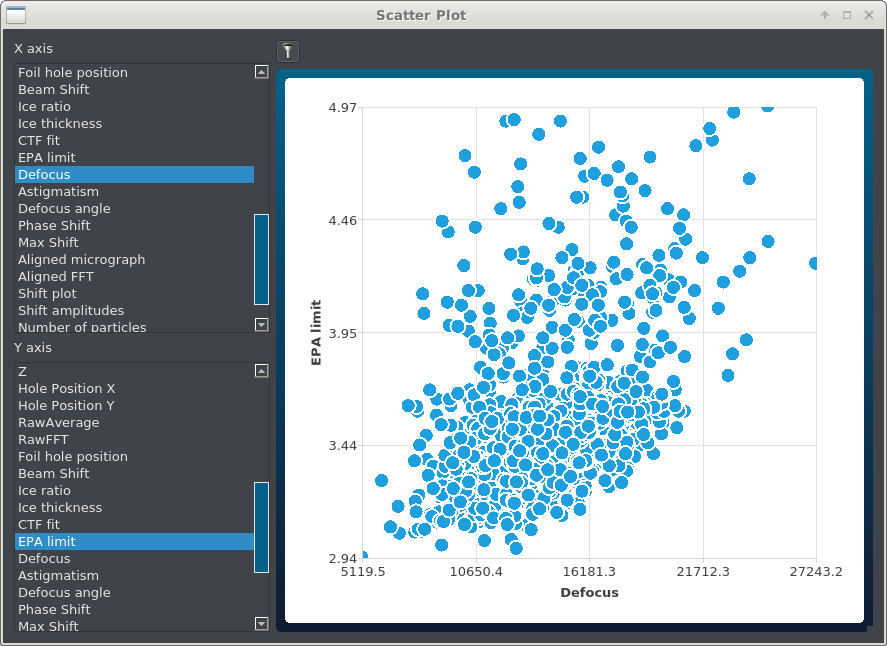 Any two parameters can be plotted against each other in a scatter plot.
General tab contains general settings and controls visibility of default columns. Number of CPU and GPU processes should be set to number of cores and GPUs in the system CryoFLARE is running on. GPU can be oversubscribed to some extent but Motioncorr2 doesn’t run too efficient when oversubscribed.
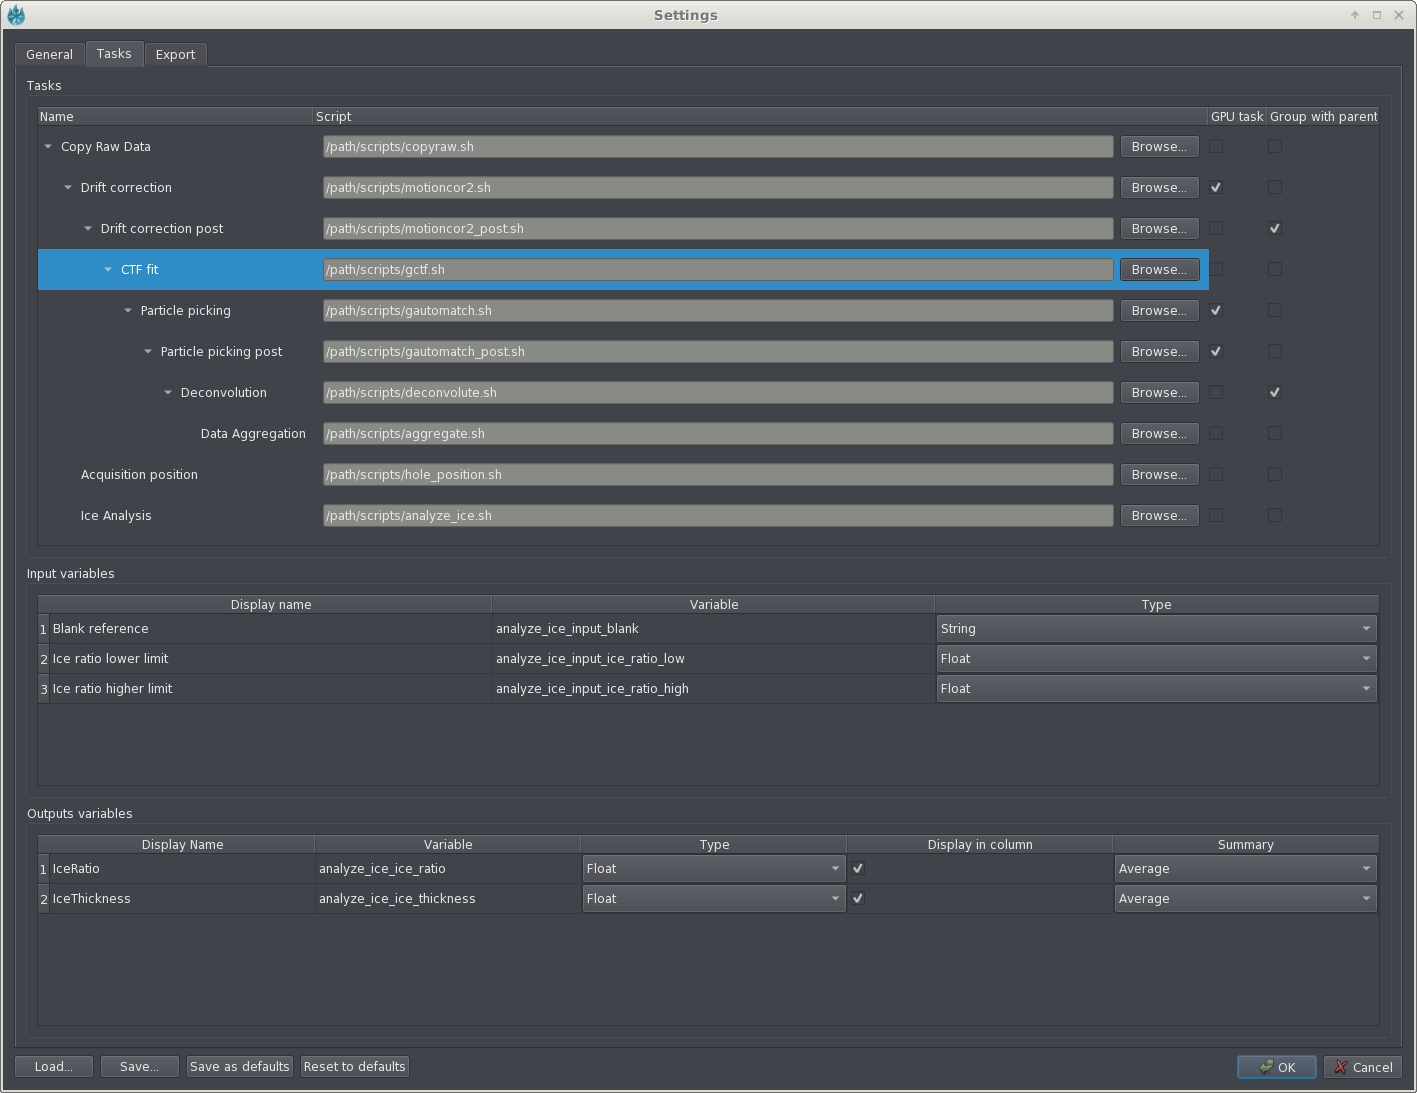 The task tab defines the tasks to be run. They are arranged in a dependency tree. To add or delete task you can use the right click menu. Each task is either run in the CPU or GPU queue (defined by GPU task check mark) . The group with parent check mark defines whether results from a task are grouped together with the results of the parent (e.g. analysis of the motion correction, which conceptually belong to the motion correction script).
In the middle and bottom panel, one can define a set of input parameters and output parameters for each task. For each input parameter a input box is created in the GUI, where the user can enter a value.
Each output parameter is read out from the standard output of the script and is either displayed in the table containing all images (display in column check mark) or displayed on the right side of the GUI in the detailed results for an image. In the details output images can be displayed as well. The summary column for the output variables defines whether the sum or average over all images should be calculated for this variable and displayed below the image table.
All output parameters are given as input parameters for subsequent scripts. For example, the motion correction defines the averaged image as output parameter, so that the particle picking can use that image in its script.
The task tab defines the tasks to be run. They are arranged in a dependency tree. To add or delete task you can use the right click menu. Each task is either run in the CPU or GPU queue (defined by GPU task check mark) . The group with parent check mark defines whether results from a task are grouped together with the results of the parent (e.g. analysis of the motion correction, which conceptually belong to the motion correction script).
In the middle and bottom panel, one can define a set of input parameters and output parameters for each task. For each input parameter a input box is created in the GUI, where the user can enter a value.
Each output parameter is read out from the standard output of the script and is either displayed in the table containing all images (display in column check mark) or displayed on the right side of the GUI in the detailed results for an image. In the details output images can be displayed as well. The summary column for the output variables defines whether the sum or average over all images should be calculated for this variable and displayed below the image table.
All output parameters are given as input parameters for subsequent scripts. For example, the motion correction defines the averaged image as output parameter, so that the particle picking can use that image in its script.
The export tab defines how the data is copied during export. Currently the export script I wrote for our site is not included, as it contains many site-specific paths. I should be able to provide a more general script at a later stage.
If in the GUI a task defines input parameter “task_input_example” and output parameter “task_output_example” it can be used in a shell script as follows: There are also macros called FILES and RAW_FILES that work the same way as RESULTS. In addition, they flag their output as files that should be copied during the exporting. The scripts included contain “module load” commands to load the EM software installed on our system. This part needs to be adjusted to fit your local setup.
    #!/bin/bash
    # The data connector handles the parameter input and output and
    # provides some convenience macros
    . data_connector.sh

    # now the input parameters can be directly used in the script
    echo “This is my input parameter: $task_input_example”

    # In the next step we define our output parameter and hand it back to the GUI
    task_output_example=5
    RESULTS task_output_example
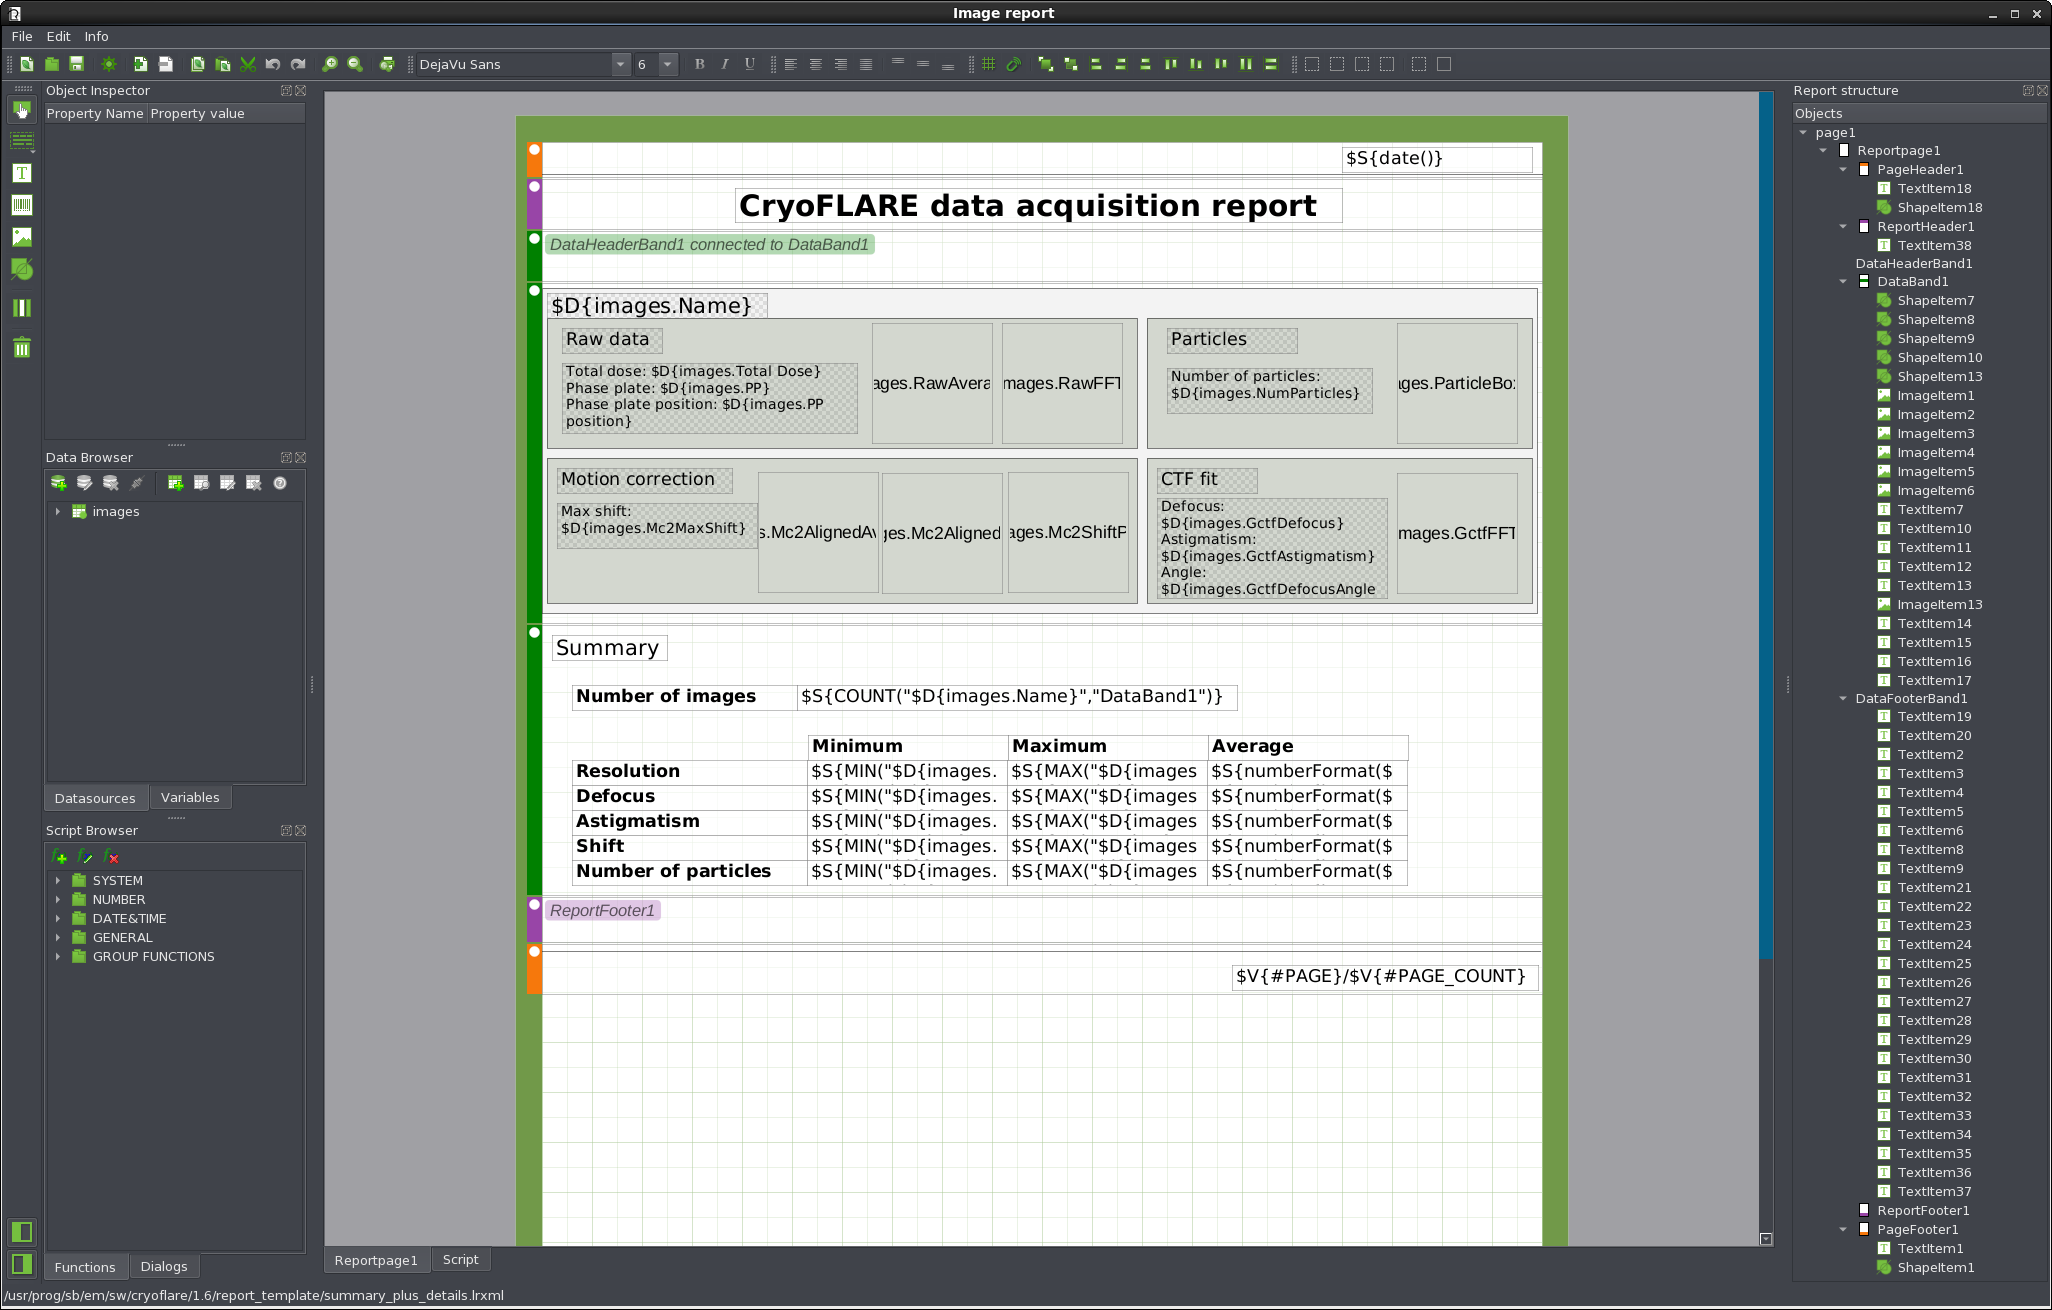 The report creation in CryoFLARE is based on the Lime report generator framework: limereport.ru.
A detailed description of the report designer can be found here.
The report creation in CryoFLARE is based on the Lime report generator framework: limereport.ru.
A detailed description of the report designer can be found here.